

Article Sidebar
Downloads
Main Article Content
Abstract
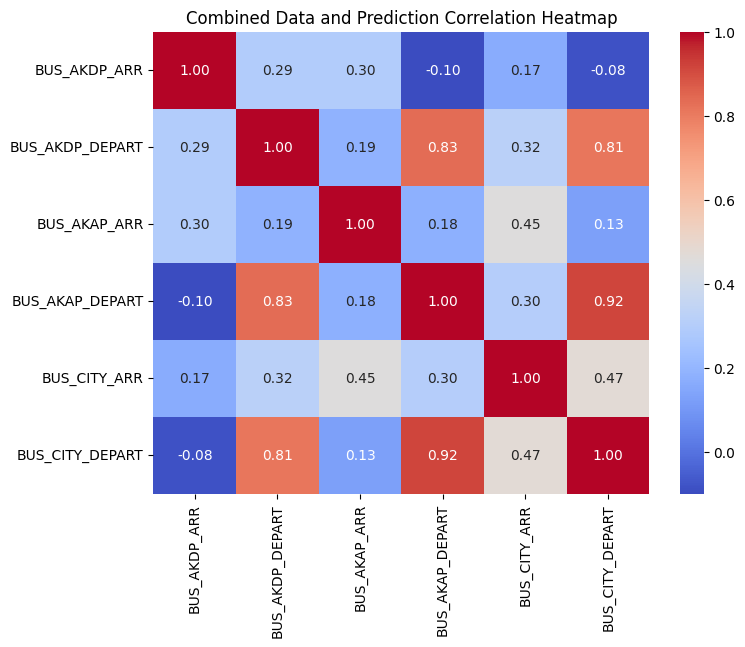
Predicting the number of bus station fleets requires a holistic approach, using sophisticated data analysis techniques and appropriate predictive modeling. Short-term predictions of bus station fleet numbers are proposed based on the best MAPE evaluation values from the comparison of the Bi-LSTM, BiLSTM-CNN, BiLSTM-Transformer, BiLSTM-Informer, and BiLSTM-Reformer models. The dataset used is in the form of a CSV consisting of 6 types of arrivals and departures of the Giwangan City Yogyakarta type A bus station fleet from 01/01/2021 to 09/30/2023. The best prediction model was found in BiLSTM-Transformers based on a MAPE value of 0.2211 with a relatively fast time (00:00:52) compared to BiLSTM, BiLSTM-CNN, BiLSTM-Informer, and BiLSTM-Reformer. The BiLSTM-Transformer model can short-term predict 6 types of fleet arrivals and departures at the bus station in the next 30 days. The peak of the bar and curve is at 0 which means the proposed prediction model is very accurate. There is 1 strong positive correlation, 2 weak positive correlations, 2 strong negative correlations, 8 weak negative ones, and 2 uncorrelated ones. Prediction results can be used to support short-term decision making in fleet planning and management based on the dynamics of community mobility.
Keywords
Article Details

This work is licensed under a Creative Commons Attribution-NonCommercial 4.0 International License.
References
- C. Li, “Landscape design of the urban bus station based on the urban characteristics and ecological environment of Smart City, China,” Fresenius Environmental Bulletin, vol. 29, no. 4, pp. 3300–3307, 2020.
- P. Tworzewski, W. Raczkiewicz, W. Grzmil, and P. Czapik, “Condition assessment of selected reinforced concrete structural elements of the bus station in Kielce,” MATEC Web of Conferences, vol. 284, p. 06007, Jul. 2019, doi: 10.1051/matecconf/201928406007.
- C. Yoon, Y. Kim, and J. Sung, “Study on Bus Clearance Time Calculation at Bus Station Using Digital Tacho Graph,” International Journal of Highway Engineering, vol. 23, no. 6, pp. 185–193, Dec. 2021, doi: 10.7855/ijhe.2021.23.6.185.
- S. R. Kewate, V. R. Gandhewar, and V. R. Holey, “Survey Analysis for Quality Enhancement of MSRTC Bus Station - A Review Research,” International Journal of Scientific Research in Science and Technology, pp. 362–369, Oct. 2021, doi: 10.32628/ijsrst218548.
- J. Seo, S. Cho, D. Kim, and P. Y. Park, “Analysis of overlapping origin–destination pairs between bus stations to enhance the efficiency of bus operations,” IET Intelligent Transport Systems, vol. 14, no. 6, pp. 545–553, Jun. 2020, doi: 10.1049/iet-its.2019.0158.
- G. Schmid, “Infrastructure buildings – New design language for urban architecture: Bus stations, tram stations, transfer hubs,” in 10th edition of the conference on Textile Composites and Inflatable Structures, CIMNE, 2021. doi: 10.23967/membranes.2021.026.
- M. Y. Alfyan and D. T. Widyastuti, “Node-Place Model Analysis on Attached Transit Oriented Development (TOD) Areas : The Case of Wates Train and Bus Station Area,” Built Environment Studies, vol. 3, no. 1, pp. 8–16, Apr. 2022, doi: 10.22146/best.v3i1.1856.
- Prof. Sunil R. Kewate, Prof. Dr. Vivek R. Gandhewar, and Kartik D. Ukhalkar, “Implementation Analysis for Energy Audit Process at MSRTC Bus Station- A Review Research,” International Journal of Scientific Research in Science and Technology, pp. 521–526, Oct. 2021, doi: 10.32628/ijsrst218580.
- P. Zhan, X. Liu, Y. Cao, L. Lu, X. He, and Y. Sun, “Data Management of Space Station Bus Network,” in Lecture Notes of the Institute for Computer Sciences, Social-Informatics and Telecommunications Engineering, 2021, pp. 392–400. doi: 10.1007/978-3-030-69072-4_31.
- J. Siswanto, H. Hendry, U. Rahardja, I. Sembiring, and E. A. Lisangan, “Predicting Transjakarta Passengers with LSTM-BiLSTM Deep Learning Models for Smart Transportpreneurship,” Aptisi Transactions on Technopreneurship (ATT), vol. 7, no. 1, Feb. 2025, doi: 10.34306/att.v7i1.440.
- X. M. Song, S. T. Yang, M. X. Liu, and Z. H. Li, “Fluctuation characteristics and prediction method of bus travel time between stations,” Jilin Daxue Xuebao (Gongxueban)/Journal of Jilin University (Engineering and Technology Edition), vol. 52, no. 8, 2022, doi: 10.13229/j.cnki.jdxbgxb20210248.
- J. Juanita, S. Suwarno, M. I. Sarifudin, and T. H. Setiawan, “Potential Development of Trans Central Java Bus Rapid Transit (BRT) Corridor 1 Towards Sustainable Mobility,” Automotive Experiences, vol. 6, no. 1, pp. 188–199, Apr. 2023, doi: 10.31603/ae.8369.
- L. Zhu, S. Shu, and L. Zou, “XGBoost-Based Travel Time Prediction between Bus Stations and Analysis of Influencing Factors,” Wireless Communications and Mobile Computing, vol. 2022, pp. 1–25, Jul. 2022, doi: 10.1155/2022/3504704.
- L. Li, H. Liu, Y. Wang, X. Han, T. Ge, and L. Pan, “Construction of a nomogram for predicting the risk of allergic rhinitis among employees of long‐distance bus stations in China,” Indoor Air, vol. 30, no. 6, pp. 1178–1188, Nov. 2020, doi: 10.1111/ina.12694.
- C. Chen, S. Hu, W. Y. Ochieng, N. Xie, and X. (Michael) Chen, “Understanding City-Wide Ride-Sourcing Travel Flow: A Geographically Weighted Regression Approach,” Journal of Advanced Transportation, vol. 2021, pp. 1–15, Jun. 2021, doi: 10.1155/2021/9929622.
- L. Zou, L. Guo, L. Zhu, and Z. Yu, “Entropy Model of Dynamic Bus Dispatching Based on the Prediction of Back-Station Time,” Sustainability, vol. 15, no. 4, p. 2983, Feb. 2023, doi: 10.3390/su15042983.
- F. Jia, H. Zhang, and X. Hu, “RHMX: Bus arrival time prediction via mixed model,” Journal of Electronic Research and Application, vol. 5, no. 6, pp. 30–43, Nov. 2021, doi: 10.26689/jera.v5i6.2708.
- H. Liu, H. Xu, Y. Yan, Z. Cai, T. Sun, and W. Li, “Bus Arrival Time Prediction Based on LSTM and Spatial-Temporal Feature Vector,” IEEE Access, vol. 8, pp. 11917–11929, 2020, doi: 10.1109/access.2020.2965094.
- Z.-Q. Huang, Y.-C. Chen, and C.-Y. Wen, “Real-Time Weather Monitoring and Prediction Using City Buses and Machine Learning,” Sensors, vol. 20, no. 18, p. 5173, Sep. 2020, doi: 10.3390/s20185173.
- C. Yang, X. Ru, and B. Hu, “Route Temporal-Spatial Information Based Residual Neural Networks for Bus Arrival Time Prediction,” Journal of Harbin Institute of Technology (New Series), vol. 27, no. 4, 2020, doi: 10.11916/j.issn.1005-9113.2018007.
- J. Siswanto, D. Manongga, I. Sembiring, and S. Wijono, “Deep Learning Based LSTM Model for Predicting the Number of Passengers for Public Transport Bus Operators,” Jurnal Online Informatika, vol. 9, no. 1, pp. 18–28, Apr. 2024, doi: 10.15575/join.v9i1.1245.
- Mardiana, J. Siswanto, M. F. Kamil, B. N. Henry, A. Ramadan, and M. A. Komara, “Leveraging Big Data Technologies for Economic Growth in the Digital Era,” in 2024 3rd International Conference on Creative Communication and Innovative Technology (ICCIT), IEEE, Aug. 2024, pp. 1–7. doi: 10.1109/ICCIT62134.2024.10701184.
- J. Siswanto et al., “Hybrid Deep Learning Model of LSTM and BiLSTM for Transjakarta Passenger Prediction,” in 2024 3rd International Conference on Creative Communication and Innovative Technology (ICCIT), IEEE, Aug. 2024, pp. 1–7. doi: 10.1109/ICCIT62134.2024.10701094.
- C. Wu and X. Qi, “Short-term Bus Passenger Flow Forecast Based on CNN-BiLSTM,” Advances in Engineering Technology Research, vol. 5, no. 1, p. 448, May 2023, doi: 10.56028/aetr.5.1.448.2023.
- J. Siswanto, I. Sembiring, A. Setiawan, and I. Setyawan, “Number of Cyber Attacks Predicted With Deep Learning Based LSTM Model,” JUITA : Jurnal Informatika, vol. 12, no. 1, p. 39, May 2024, doi: 10.30595/juita.v12i1.20210.
- Y. Pei, S. Ran, W. Wang, and C. Dong, “Bus-Passenger-Flow Prediction Model Based on WPD, Attention Mechanism, and Bi-LSTM,” Sustainability, vol. 15, no. 20, p. 14889, Oct. 2023, doi: 10.3390/su152014889.
- B. Jang, M. Kim, G. Harerimana, S. Kang, and J. W. Kim, “Bi-LSTM Model to Increase Accuracy in Text Classification: Combining Word2vec CNN and Attention Mechanism,” Applied Sciences, vol. 10, no. 17, p. 5841, Aug. 2020, doi: 10.3390/app10175841.
- L. Xian and L. Tian, “Passenger flow prediction and management method of urban public transport based on SDAE model and improved Bi-LSTM neural network,” Journal of Intelligent & Fuzzy Systems, vol. 45, no. 6, pp. 10563–10577, Dec. 2023, doi: 10.3233/JIFS-232979.
- F. Shahid, A. Zameer, and M. Muneeb, “Predictions for COVID-19 with deep learning models of LSTM, GRU and Bi-LSTM,” Chaos, Solitons & Fractals, vol. 140, p. 110212, Nov. 2020, doi: 10.1016/j.chaos.2020.110212.
- Mustaqeem, M. Sajjad, and S. Kwon, “Clustering-Based Speech Emotion Recognition by Incorporating Learned Features and Deep BiLSTM,” IEEE Access, vol. 8, pp. 79861–79875, 2020, doi: 10.1109/ACCESS.2020.2990405.
- R. L. Abduljabbar, H. Dia, and P.-W. Tsai, “Unidirectional and Bidirectional LSTM Models for Short-Term Traffic Prediction,” Journal of Advanced Transportation, vol. 2021, pp. 1–16, Mar. 2021, doi: 10.1155/2021/5589075.
- H. Jahangir, H. Tayarani, S. S. Gougheri, M. A. Golkar, A. Ahmadian, and A. Elkamel, “Deep Learning-Based Forecasting Approach in Smart Grids With Microclustering and Bidirectional LSTM Network,” IEEE Transactions on Industrial Electronics, vol. 68, no. 9, pp. 8298–8309, Sep. 2021, doi: 10.1109/TIE.2020.3009604.
- J. Siswanto, B. Daniawan, H. Haryani, and P. Rusmandani, “Testing Of Deep Learning-Based LSTM Model For Number Of Road Accidents Predicting,” Jurnal Sains, Nalar, dan Aplikasi Teknologi Informasi, vol. 3, no. 3, pp. 95–103, Jul. 2024, doi: 10.20885/snati.v3.i3.37.
- J. Siswanto et al., “Number of Road Accidents Predicting Using Deep Learning-Based LSTM Development Models,” in 2023 11th International Conference on Cyber and IT Service Management (CITSM), IEEE, Nov. 2023, pp. 1–6. doi: 10.1109/CITSM60085.2023.10455169.
- H. Zheng, F. Lin, X. Feng, and Y. Chen, “A Hybrid Deep Learning Model With Attention-Based Conv-LSTM Networks for Short-Term Traffic Flow Prediction,” IEEE Transactions on Intelligent Transportation Systems, vol. 22, no. 11, pp. 6910–6920, Nov. 2021, doi: 10.1109/TITS.2020.2997352.
- S. Liyanage, R. Abduljabbar, H. Dia, and P.-W. Tsai, “AI-based neural network models for bus passenger demand forecasting using smart card data,” Journal of Urban Management, vol. 11, no. 3, pp. 365–380, Sep. 2022, doi: 10.1016/j.jum.2022.05.002.
- L. Liu, Y. Li, Y. Cao, F. Liu, W. Wang, and J. Zuo, “Transient Rotor Angle Stability Prediction Based on Deep Belief Network and Long Short-term Memory Network,” IFAC-PapersOnLine, vol. 52, no. 4, pp. 176–181, 2019, doi: 10.1016/j.ifacol.2019.08.175.